
Understanding the dashboard
The dashboard gives you statistics on activity.
This is the default interface when you log on to Kavkom.

Filter by time interval
You can choose a time interval, to view statistics for a selected period.
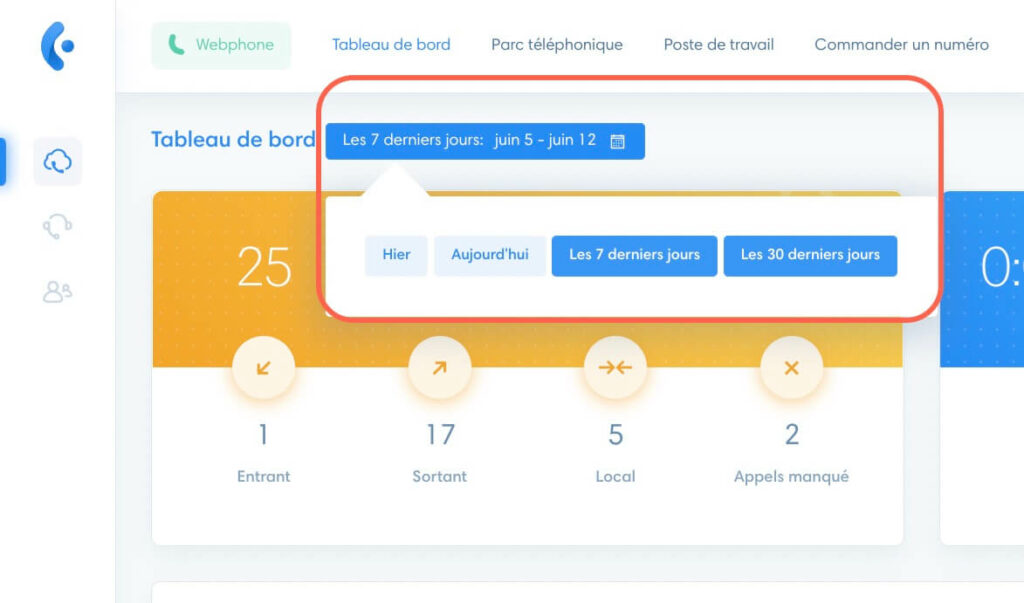
“Call statistics” section
Click on the various statistics in the “Call statistics” section to view detailed statistics.

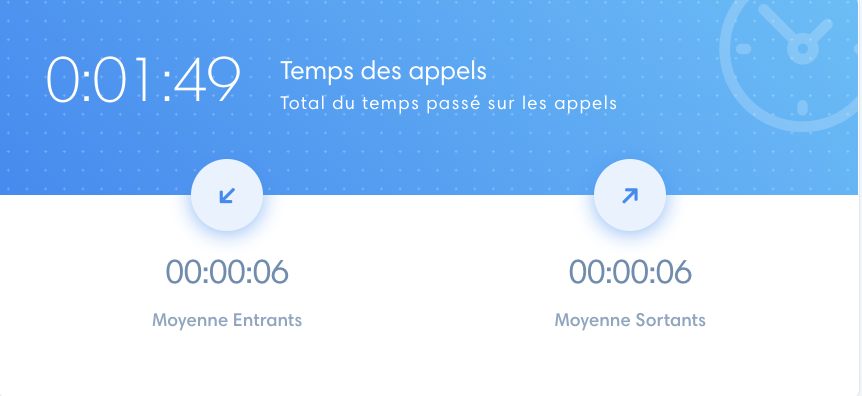
Call time section
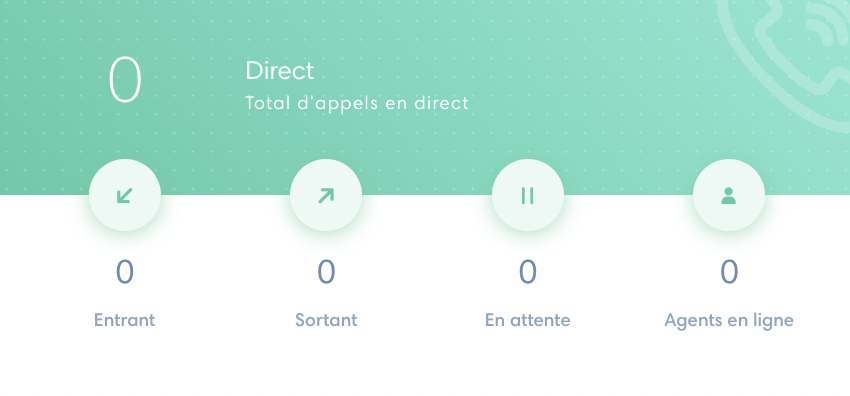
Live section
This section is not affected by time intervals, as it displays statistics for calls in progress.
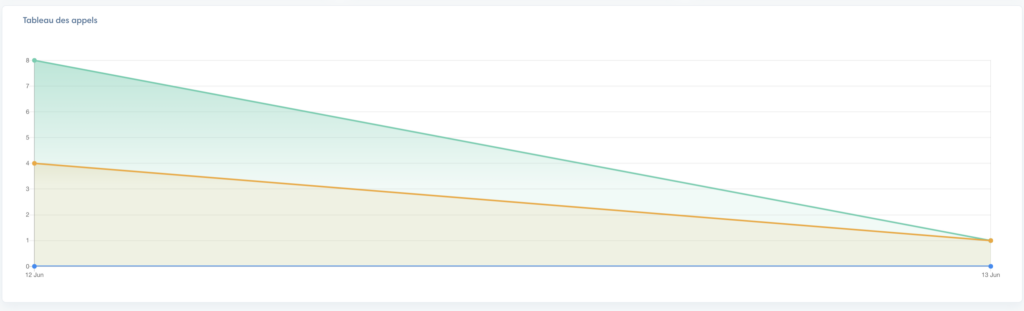
Calls chart section
This section displays the types of calls that have been made:
- In orange : inbound calls
- In blue : local calls
- In green : outbound calls