

When you use Kavkom’s integration with HubSpot, every Kavkom call will be recorded in HubSpot, depending on your integration settings, as an engagement, or call activity.
With HubSpot’s reporting tool, you can track Kavkom call statistics based on call activity and owner information!
Here’s how to access the call activity reporting tool.
Creating a report
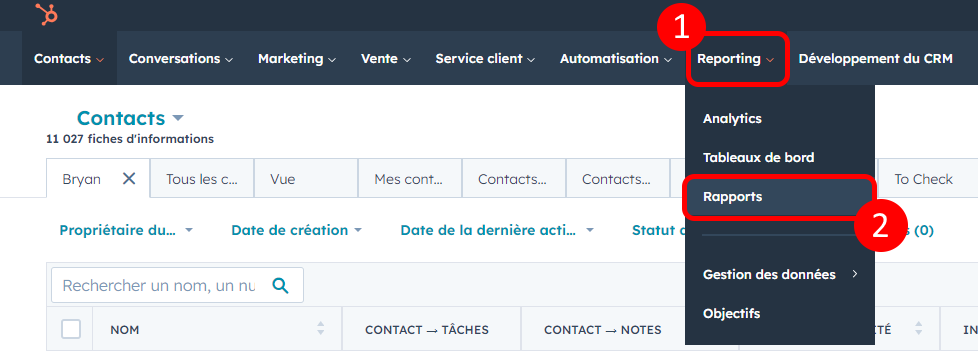
Click on the “Reporting” drop-down menu, then on “Reports” :
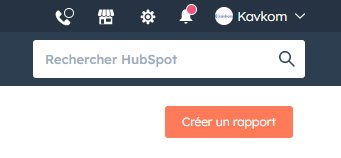
Click on “Create a report” in the top right-hand corner:
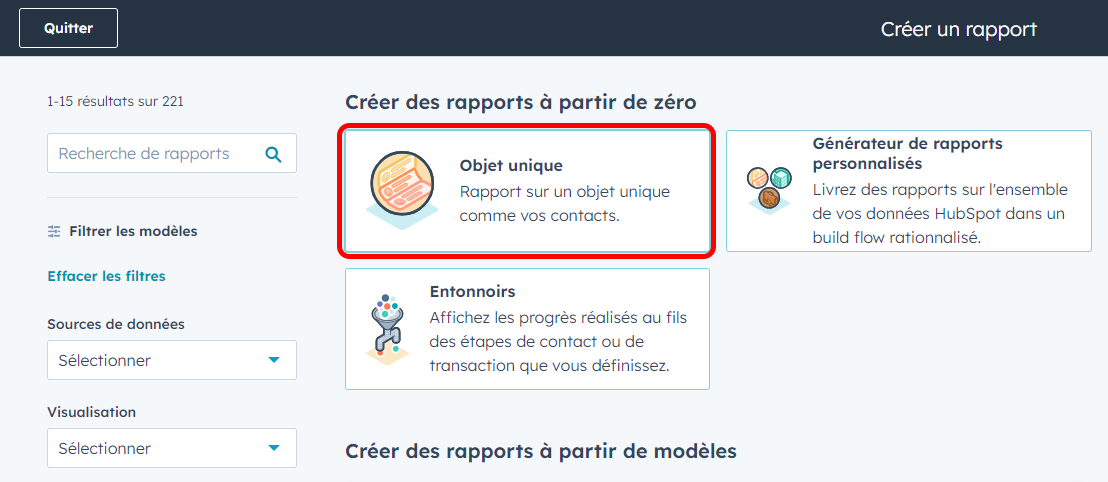
Click on “Single object” :
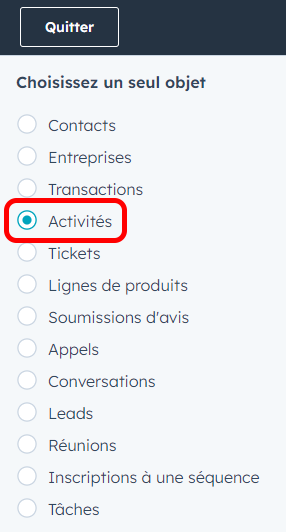
Finally, select “Activities”, then click on “Next” in the top right-hand corner:
Here are a few examples of reports you can build.
Total calls
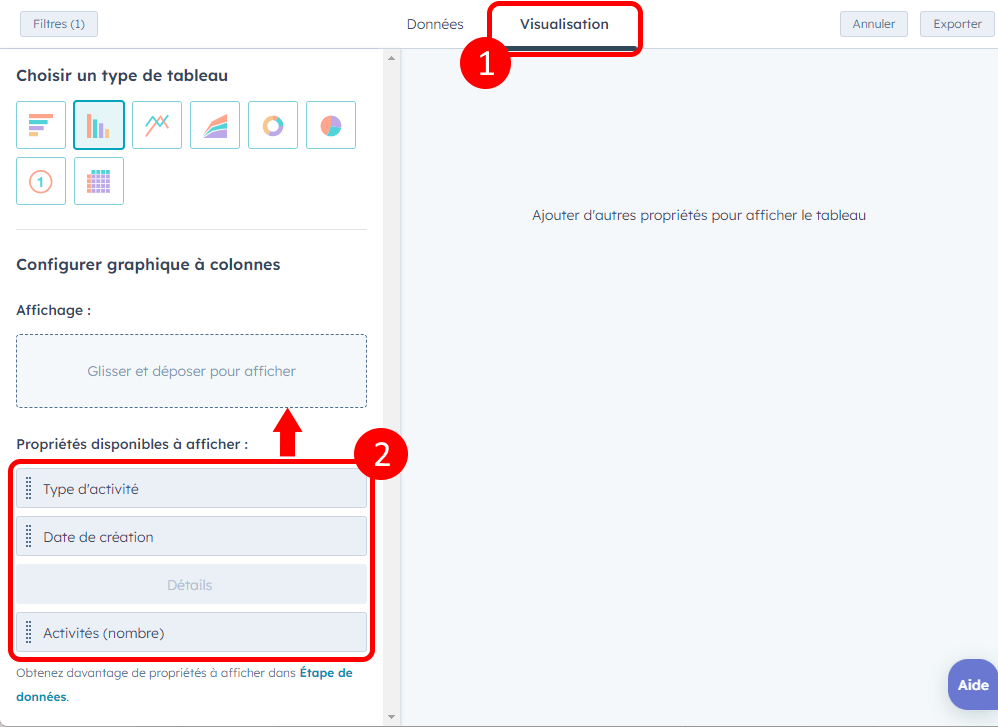
In the “Visualization” tab, in the “Choose a table type” section, select the desired display, then in the “Configure chart” section drag “Creation date” (or any other property) and “Activities (number)” from the “Available properties” section to the “Display” section.
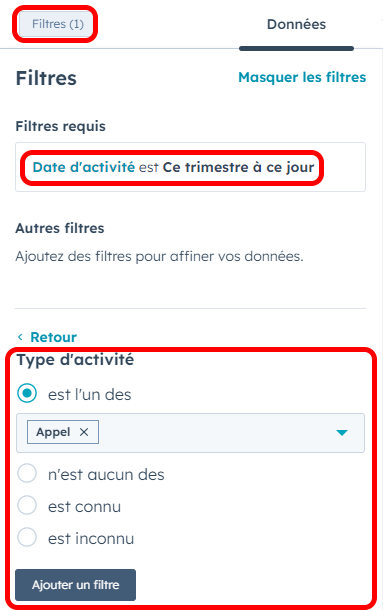
Click on “Filters” in the top left-hand corner and select the period of your choice in the “Activity date” section. Then click on “Add filter” → “Activity type” → “is one of: Call”, then on “Add filter” :
Click on ‘Save’, and you’re done!
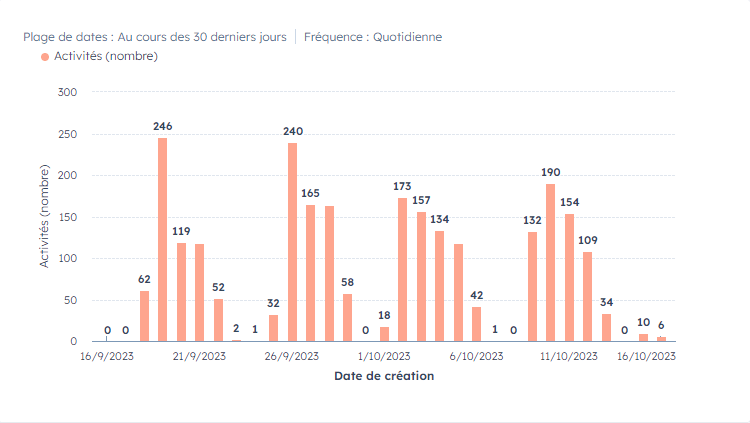
This report will show the total number of calls in the selected period, broken down according to the frequency you have chosen (daily, monthly, annually, etc.). For a more detailed breakdown of calls, simply click on one of the graph’s data points.
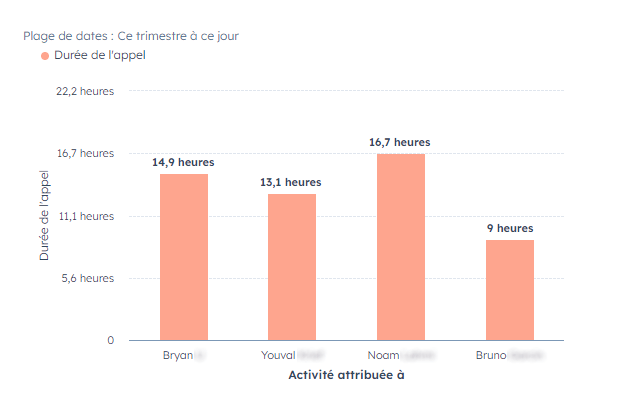
Total call duration
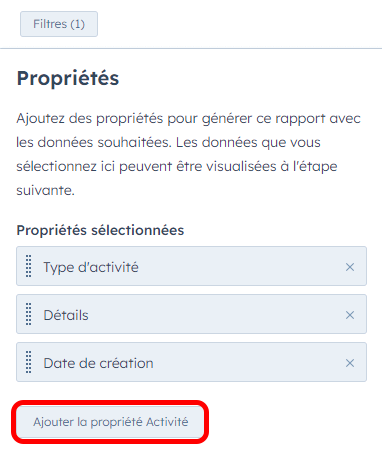
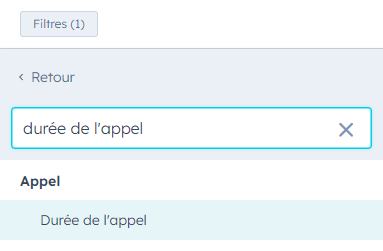
Click on the Reporting drop-down menu → Reports → Create a report → Single object → Activities → Next → Add an activity property (in the Data section) :
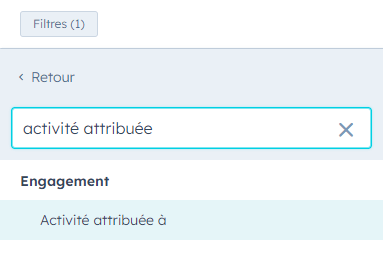
Go to the Visualization section → click and drag ‘Call duration’ and ‘Activity assigned to’ to the ‘Display’ section → choose the type of graph you want, click ‘Save’, and you’re done!
This report will show how much time each user spends on calls in the selected period. To obtain a breakdown of calls, simply click on one of the graph’s data points.
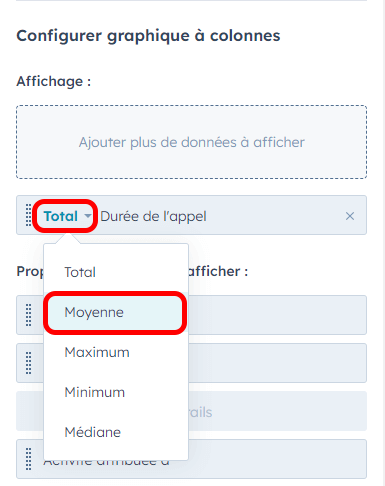
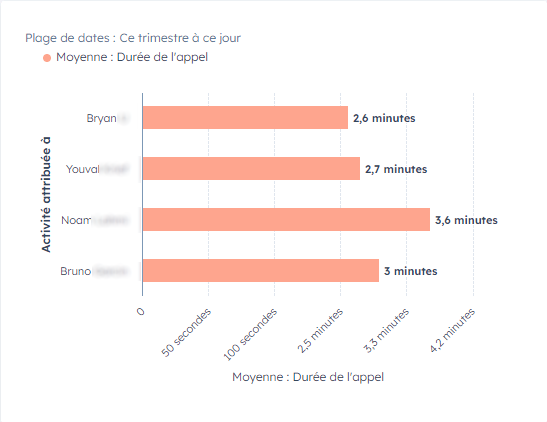
Average call duration
Follow the same steps as for the Total call duration report, but in the “Visualization” tab, on the “Call duration” property, replace “Total” with “Average” on the :
This report will show the average time each user spends on calls in the selected period. To obtain a breakdown of calls, simply click on one of the graph’s data points.
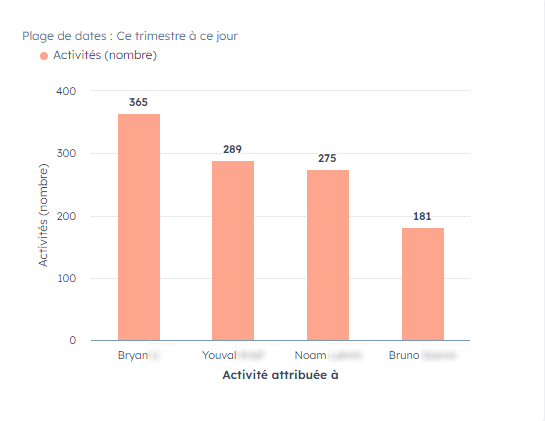
Calls made by user
Click on the Reporting drop-down menu → Reports → Create a report → Single object → Activities → Next → Add an activity property → Activity assigned to → View → click and drag “Activity assigned to” and “Activity count” to the “View” section → choose your preferred chart type → click on Filters at top left → select the time interval of your choice → click on Add filter → Activity type → is one of the : Call → click on “Save”, and it’s done!
This report will show the number of calls each user has made/received in the selected period. To obtain a breakdown of calls, simply click on one of the graph’s data points.
These are just a few examples of how HubSpot’s reporting tool can help you visualize the call data you need. Feel free to use them as guides to create new reports for the Kavkom call metrics that are important to your team!
